
POSITIONING / MACRO RESEARCH
How to read COT: who holds the position and what changed
MDS MACRO editorial team · published · methodology updated
Key takeaway
COT helps assess accumulated positions and weekly changes. It provides context for an idea's vulnerability, not a measure of current cash flowing into a currency pair.
Two dates are essential
The standard weekly CFTC report is released on Friday at 15:30 New York time and reflects Tuesday's positions. Follow the official schedule for delays. Markets may have changed between the snapshot and publication. Always state both dates and events since the snapshot.
First define what is being compared
Select one contract, one participant category and one report type. Do not mix Futures Only with Futures and Options Combined. Net equals Long minus Short. The Net level and its weekly change answer different questions: whether a bias has accumulated and whether it is increasing now.
Illustrative MDS example — not real positions
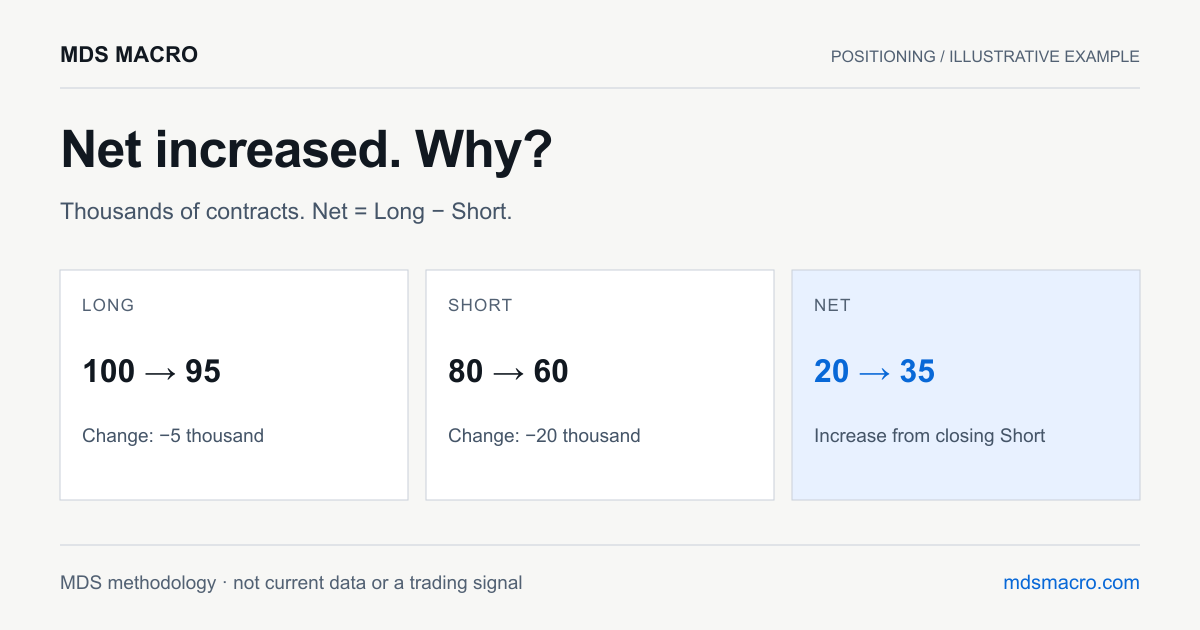
A week ago: Long 100,000, Short 80,000, Net +20,000. Now: Long 95,000, Short 60,000, Net +35,000. Net increased by 15,000, but buying did not increase. Long positions fell by 5,000 and shorts by 20,000. The precise conclusion is that the net bias rose because Short declined more.
How to use history
Compare Net with the range of the same series over a predetermined window, such as 156 weeks. A simple COT Index is 100 × (Net − minimum) / (maximum − minimum). If the minimum equals the maximum, the index is undefined. A value of 90 indicates position within the range, not a 90% reversal probability. Do not publish the measure without a complete series.
What traders gain
If a large accumulated bias stops growing while macro data turn against the idea, check the risk of position unwinding. An extreme alone does not time a reversal and can persist. Match currency futures to the pair's quote convention. Do not mechanically transfer the sign to an inverse pair.
MDS / CHECK THE CALCULATION
Explore with your own inputs
Default values come from this article's illustrative example. Change them to check the arithmetic. They are not current market data.
ΔLong -5 thousand · ΔShort -20 thousand. ΔNet = ΔLong − ΔShort. Net positioning increased while Long fell. The increase in Net came from a larger reduction in Short.
Sources and data limitations
This is an educational calculation, not a historical COT ranking. The official CFTC archive includes Futures Only from 1986 and combined reports from 1995. Check continuity for the specific contract and category before comparing.
CFTC · COT report composition, timing and historyHistorical facts were checked against the cited official document. Illustrative numbers, calculations and explanations are the MDS methodology, not current data or a test of strategy profitability. The methodology date does not change when the calendar synchronizes automatically.