
INFLATION / MACRO RESEARCH
How to read CPI: what inflation changes for traders
MDS MACRO editorial team · published · methodology updated
Key takeaway
An inflation release matters through its effect on the expected rate path. A robust conclusion requires consistent components, not merely a high annual CPI reading.
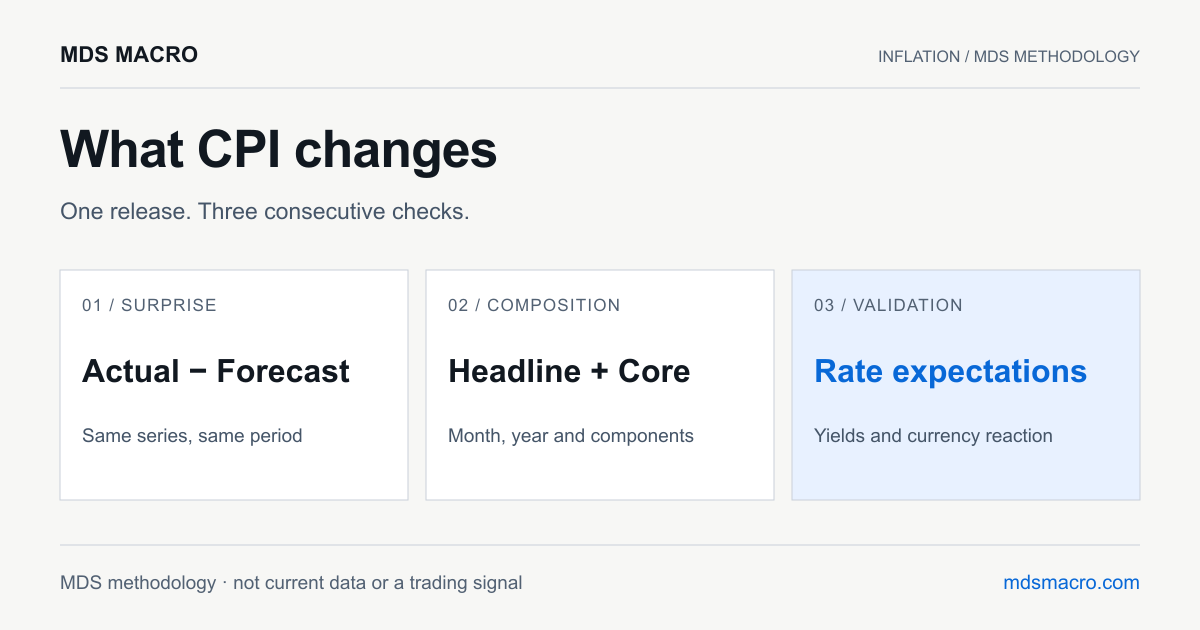
First — comparable figures
Compare Actual with Forecast for the same country, period and series. The monthly rate measures change from the preceding month, the annual rate from the same month a year earlier. Do not rank them by size: 0.4% m/m and 3% y/y answer different questions. The difference between two percentage rates is expressed in percentage points (pp).
Then — the source of pressure
Headline covers the full basket, while Core excludes food and energy. A weak Headline alongside persistent Core may mean falling energy prices mask pressure elsewhere. Annual inflation can slow because of a high comparison base even when monthly prices rise noticeably. Read both horizons, then examine component contributions.
Illustrative MDS example — not a real release
Suppose Core CPI m/m is 0.4% versus an expected 0.2%, while Headline y/y falls from 3.2% to 3.0%. The monthly surprise is +0.2 pp. Conclusion: annual disinflation does not cancel fresh core price pressure. If it raises the expected rate path, USD may benefit. For gold, the response of real yields also matters.
Historical case: United States, June 2022
The BLS release dated 13 July 2022 reported Headline CPI up 1.3% m/m seasonally adjusted and 9.1% y/y unadjusted. Core rose 0.7% m/m and 5.9% y/y. Energy contributed nearly half of the monthly increase in the overall basket, but core prices also rose. This illustrates inflation composition, not a reconstructed trading signal.
Open the official document ↗What we check after release
Compare short-term yield and currency reactions with the report. If a strong figure does not change rate expectations, the case for a sustained move is weaker. State which inflation component surprised and what should confirm the conclusion: the next report, service components or central bank comments.
MDS / CHECK THE CALCULATION
Explore with your own inputs
Default values come from this article's illustrative example. Change them to check the arithmetic. They are not current market data.
pp means percentage points. Compare the same country, period, m/m or y/y horizon and seasonal adjustment. The size of the difference does not determine the probability of a price move.
Sources and data limitations
Historical values come from the archived BLS release. The forecast and price action that day are not reconstructed here. Seasonally adjusted series may be revised.
BLS · June 2022 CPI · released 13 July 2022Historical facts were checked against the cited official document. Illustrative numbers, calculations and explanations are the MDS methodology, not current data or a test of strategy profitability. The methodology date does not change when the calendar synchronizes automatically.